Year-End Trading Review Template + Weekly Routine
A year-end trading review turns twelve months of journal entries into five numbers and three decisions: win rate and average R by setup, the sessions that paid, the cost of your most-broken rule, planned against unplanned trades, and what to keep, cut and test next year. It reads the journal, not the broker statement. The template below does the arithmetic; the weekly routine in the second half of this page is what makes a year reviewable at all.
Spec
- Category
- Journaling
- Reading time
- 10 min read
- Updated
- Sections
- 14
- Language
- English
Why review the year from the journal, not the P&L?
A profit-and-loss statement says how much. It cannot say which setup, which session or which habit produced it, because it never knew why a trade was taken. The journal has the reason, whether the trade was planned, the rule it broke and the result in R, and those are the columns a year-end review works on.
A year is long enough that a pattern no single week could show is in the numbers: a setup that wins often but pays little, a session that only felt busy, a rule broken a dozen times for a few R each. The review is the one time a year you read the journal as a whole instead of a week at a time.
Which five numbers do you pull?
Five numbers, each read from two columns of the journal. The template computes all of them once the trades are pasted in.
| Number | Reads | What it tells you |
|---|---|---|
| Win rate by setup | Setup, Result (R) | Which setups win often. On its own it says nothing about how much. |
| Average R by setup | Setup, Result (R) | What one trade of each setup is worth: the number to rank setups by. |
| Total R by session | Session, Result (R) | Which sessions paid, and which only felt busy. |
| Cost of the most-broken rule | Rule broken, Result (R) | The R lost on the trades that broke your most-broken rule: the price of one habit. |
| Planned against unplanned | Planned, Result (R) | Whether trades with a scenario written first did better than the ones without. |
Read them together. A high win rate with a low average R is a setup that pays less than it feels. A session with few trades and a large total R may be luck until it repeats. The most-broken rule's cost is one habit with a price on it.
Which habit cost the most?
Sort the rules you broke by how often, not by how much a single break cost. One disaster is an event; a repeated break is a habit, and a habit will happen again. The template counts each rule's breaks and adds up the R on those trades, so you read the two numbers side by side: a rule broken twelve times for a few R each is a bigger problem than one broken once for more.
Then look at the planned-against-unplanned split. If the unplanned trades lost and the planned ones did not, the habit already has a name: entering without a scenario written first.
What do you keep, cut and test?
Three decisions, one of each kind, each with the number that says so:
Keep: the setup with the best average R over the most trades. Ten or twenty trades can show almost any result by chance, so a setup with few trades stays on test, and the ranking firms up as the trades add up.
Cut: the habit whose cost you just measured, written as a rule you can check on a single trade before you take it.
- 03
Test: one change for one quarter, with the number that will say whether it worked and the date you will read it.
Three is the limit. Change more at once and next year cannot tell you which change mattered, which is the same rule the weekly review uses for its one variable.
How do you write next year's rules on one page?
One page you can read before every session, with nothing on it you cannot check on a trade:
- Maximum risk per trade, and the daily and weekly loss caps that stop the day or the week.
- The sessions you trade and the setups you take, by name.
- The rule that cost the most last year, written as the thing you will not do.
- The one change you are testing, how you will know it worked, and when you will read the number.
- The weekly review slot, and the date of the next year-end review.
A rule you cannot check on a trade is not a rule yet.
The template
Download the year-end review template (xlsx)Five sheets: your trades with the R formula (300 rows), the five numbers computed by formula, the three decisions, next year's rules on one page, and how to use it. Opens in Excel, Google Sheets or LibreOffice; no macros.
Paste the year's trades into the Trades sheet, one per row: date, symbol, setup, session, direction, whether it was planned, the rule it broke, entry, stop and exit. The Result column is a formula, (exit − entry) ÷ (entry − stop), which works for longs and shorts. On the Year review sheet, type your setup names and your rule names in the grey cells; everything else is computed. Six invented example trades and three example decisions show the method; delete them before you paste your own.
Why weekly, and why the same time?
The year-end review only works on a journal that was kept and read all year, and that is what the weekly routine is for. A daily review tends to chase the last trade. A week gives you enough trades to see a pattern, and few enough to read each one properly. Pick a fixed slot, the same day and time each week, and keep it even when the week was quiet. A quiet week is data too.
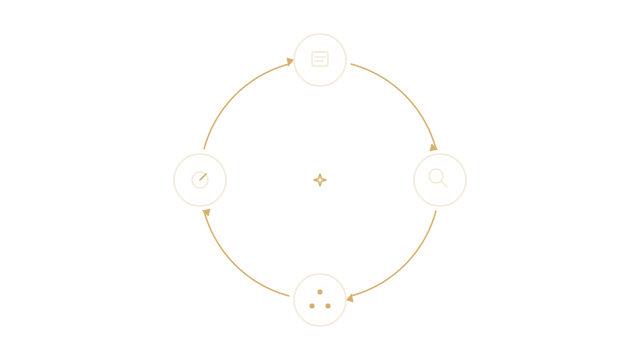
The loop only works when the four steps happen in order. Skipping the reasons and going straight to the profit and loss turns the review into a scoreboard.
What do you need before you start?
- Open every trade from the past week, and every session you skipped, with its reason.
- Check that each trade has an entry, a stop and a target. If one is missing, add it now from your broker statement and mark it as added later.
- Note the sessions you traded and the days you did not trade, so the review covers the quiet days too.
Which numbers do you check first?
Count the trades, the wins, the losses and the break-even trades. If you record your risk per trade, add the average. Write the totals on one line at the top of the page.
Numbers show what happened, not why. Set them aside before you read the reasons, so the totals do not colour how you read each trade.
How do you read the reasons?
For each trade, read the reason you wrote before the entry.
Check the time on that note. A reason written after the result is a story, not a plan. Mark it.
Check the reason against your plan. Did the setup match a scenario you had defined before the trade?
- 04
Mark each trade you would take again, and write one line on why.
Be strict with missing notes. A missing reason is information too. It often means the trade was taken on impulse, or that the journal was not kept up that day.
How do you find one pattern?
Look across the week for one thing that repeats. Four places to look are the most useful:
- Time: the session or hour when most of the losing trades were entered.
- Setup: a scenario or pattern that worked in one market and not in another.
- Feeling: the emotion you wrote before the entry, when it was the same across several trades.
- Rule: a rule you broke, or followed, more than once.
Choose the pattern that appears most often, not the one that cost the most. One large loss is one event. A repeated habit is a pattern.
How do you choose one change?
Write one sentence that describes the change, and make it something you can check next week. For example: “Wait for the retest before entering a breakout.” Put it at the top of next week’s journal, so you see it while you trade.
Change one variable at a time. If you change the setup, the timeframe and your position size in the same week, next week’s result cannot tell you which change mattered.
What does a week's review look like?
This example is invented, to show the method. It is not a result. Imagine a week with eight trades. Five have a reason written before the entry. Three were written after the result or are missing. All three of the unplanned trades were taken in the first half hour of the session.
The pattern is the timing of the unplanned trades, not the setup. The change for next week is one line: no entries in the first half hour unless a scenario was written in advance. Next week you check that line on every trade, and leave the rest of the plan alone.
Which mistakes are common?
- Reviewing only the winners, or only the trades that felt bad.
- Rewriting a reason after the result, then reading it as if it were the original.
- Changing the plan after one bad week, before a pattern has had time to repeat.
- Skipping the quiet weeks, which are where the routine is easiest to drop.
- Doing the year-end review from the broker statement, which has the results and none of the reasons.
Frequently asked questions
What is a year-end trading review?
A reading of the whole year's journal that produces five numbers (win rate and average R by setup, total R by session, the cost of the most-broken rule, and planned against unplanned trades) and three decisions: what to keep, what to cut and what to test next year. It reads the journal, not the broker statement.
When should I do it?
Once the last trade of the year is closed and logged, and before the first session of the new year; in practice, the second half of December. The same review works at any twelve-month mark, and a quarter-end version with the same five numbers is how you read a test before the year is out.
How many trades do I need?
More than most traders expect: ten or twenty trades can show almost any average by chance. Rank only the setups with the most trades taken the same way, read a small count as a hint, and keep that setup on test.
Can I do it without R?
You can, in money and percentages, but setups of different size then cannot be compared. R needs a stop recorded at entry. If you have one for most trades, compute R for those and leave the rest out of the ranking.
Is the template free, and does it send my data anywhere?
Yes, and no. It is an xlsx with formulas and no macros; it opens in Excel, Google Sheets and LibreOffice, and nothing in it connects to anything. Your trades stay in the file.