NAV-CNT-008Journaling
Trading Journal and Risk: Ten Short Answers
Ten short answers on trading journals, templates, AI review, position size, risk reward, revenge trading and year-end review, each linked to its full guide.
Istanbul7 min read
Academy · Content
A trading journal is only useful if you read it. The guides here show how to review it each week, how to write down the feeling behind each decision, and which fields a template needs so that every trade can be compared with the next. Beside them are the Smart Money Concepts datasheet and a case study written as a test report. Pick a category or search the shelf; each guide ends with a step you can take the same day.
16 sheets
Ten short answers on trading journals, templates, AI review, position size, risk reward, revenge trading and year-end review, each linked to its full guide.
Istanbul7 min read
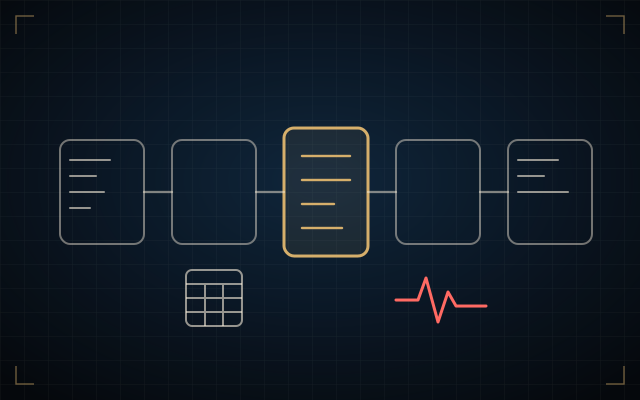
Navrya's trade form logs a trade in five steps: numbers and calculator, a read of each timeframe, screenshots, up to three emotions. No broker link.
Istanbul5 min read
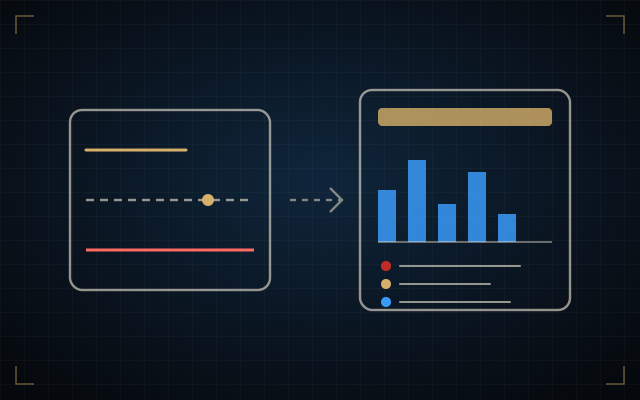
How Navrya's AI trade review reads one logged trade against your plan, strategy, session and analysis profile, what it returns and what it never does.
Istanbul5 min read
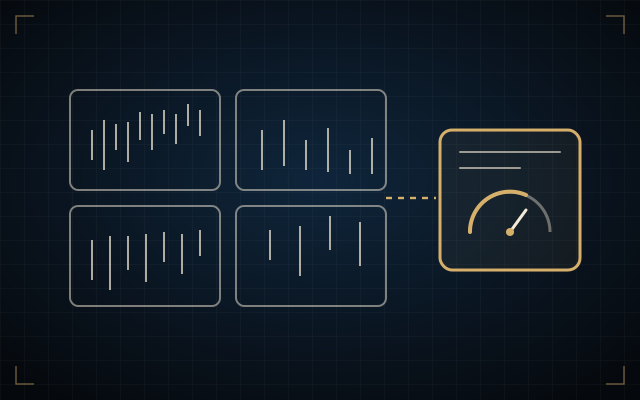
Navrya's analysis session: up to four charts, an AI read across timeframes, your scenarios, the position and the outcome on one desk. No signals, no broker.
Istanbul5 min read
Navrya account rules: maximum risk per trade and daily loss cap. Navrya checks each new trade against them; the assistant asks before filling in one over them.
Istanbul5 min read
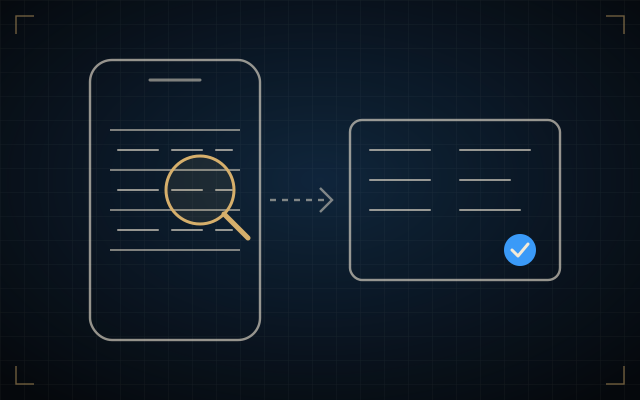
Navrya reads the entry, exit, fees and result from an exchange statement screenshot; unseen figures stay empty, and nothing applies until you confirm.
Istanbul5 min read
How Navrya's Analysis Profile makes the AI read charts and review trades in your own method, how it learns from links, and what its memory keeps.
Istanbul4 min read
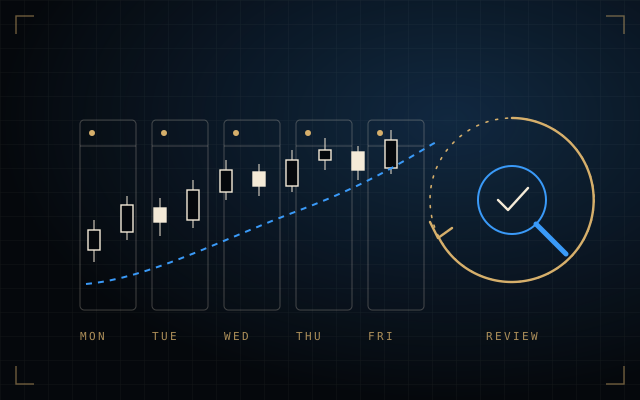
A year-end trading review turns a year of journal entries into five numbers and three decisions. Free xlsx template with formulas, plus the weekly routine.
Istanbul10 min read
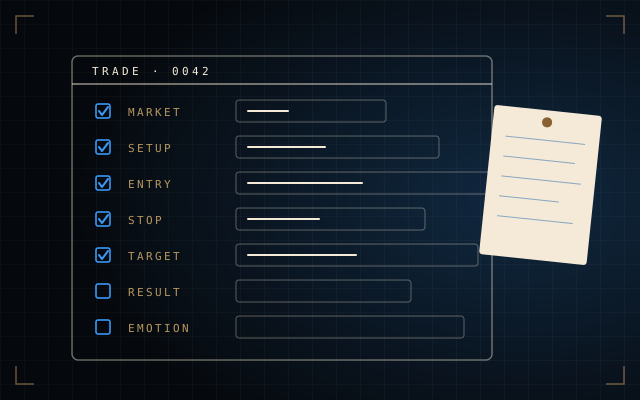
A free trading journal template for Excel or Google Sheets: 27 columns, the risk and R formulas built in, 200 rows ready, plus a CSV. What each field is for.
Istanbul7 min read
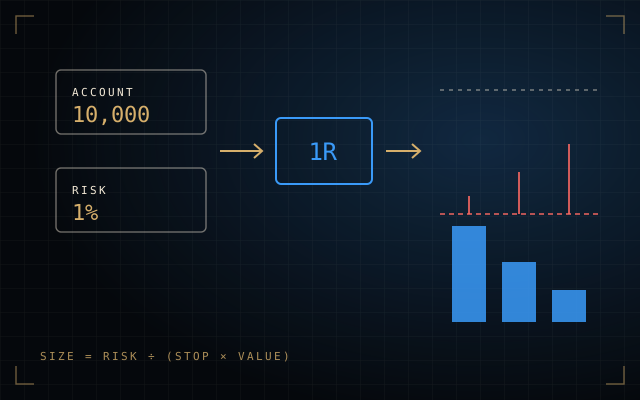
How to calculate position size from your account, risk per trade and stop distance, with worked examples for forex, yen pairs, gold, stocks and crypto.
Istanbul12 min read
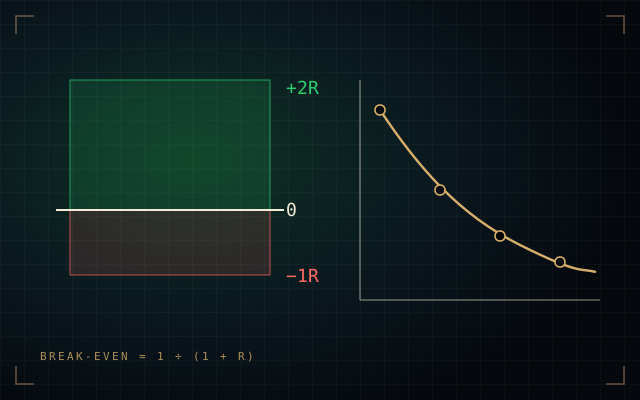
What the risk-reward ratio means, how to calculate it, and the win rate each ratio needs to break even, with trading costs, expectancy and worked examples.
Istanbul10 min read
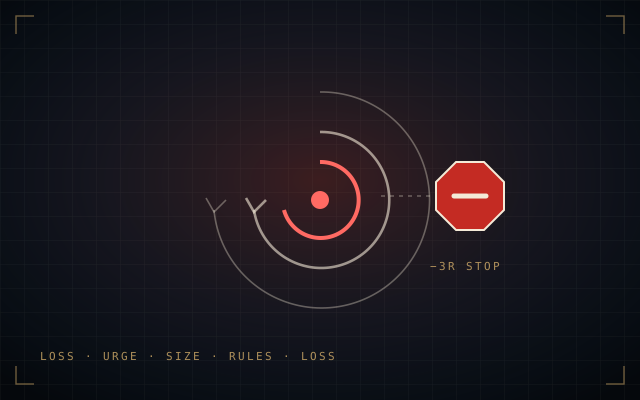
What revenge trading is, the signs you are doing it, why a loss pushes traders to size up, and the rules and journal habit that break the cycle.
Istanbul9 min read
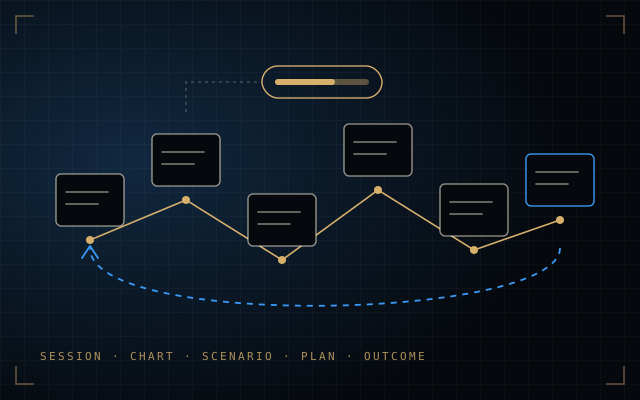
An AI trading journal reviews a logged trade against your own plan and strategy. No signals, no broker connection. What Navrya reads, with a comparison table.
Istanbul9 min read
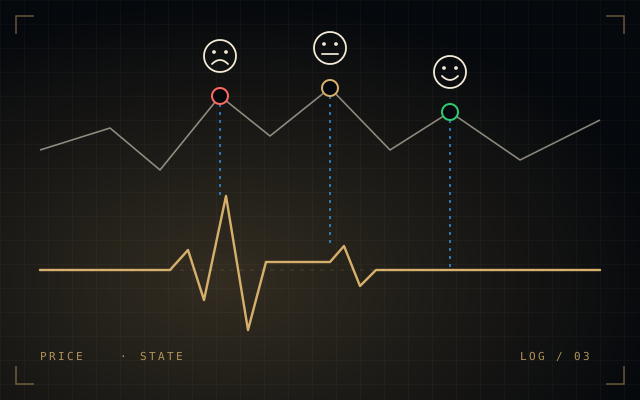
How to record fear, greed, hesitation and impulse in a trading journal, and use those notes to find the patterns that repeat.
Istanbul3 min read
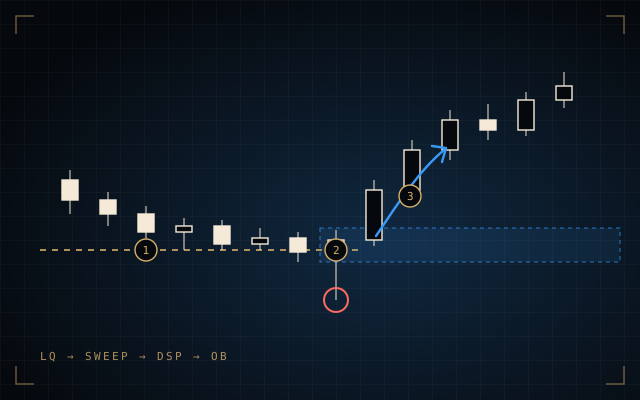
A liquidity reader. It tracks where orders rest, the sweep that takes them and the move that follows — read as probability, never as proof.
Istanbul4 min read
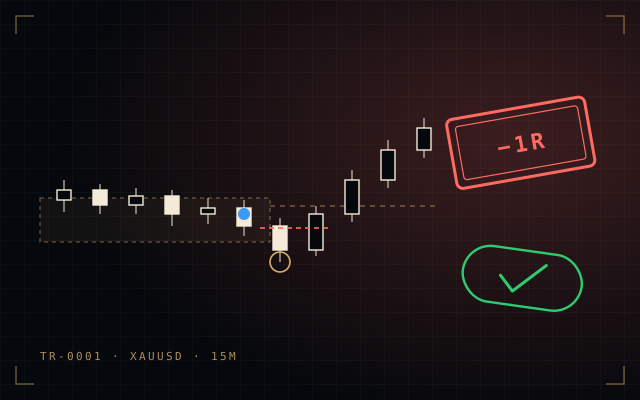
A correct read, a losing trade, and the one variable that would have changed it — a case study written as a test report.
Istanbul3 min read
What the AI trading journal records, and what it does not yet do